
Short description
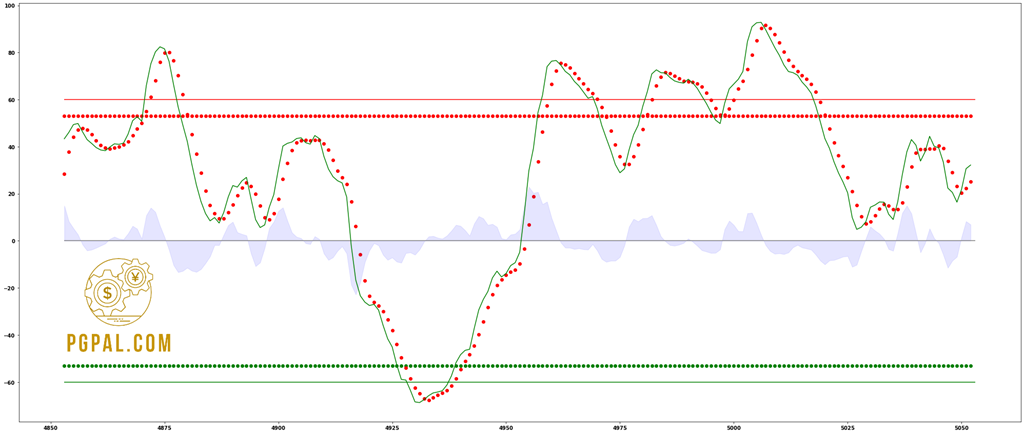
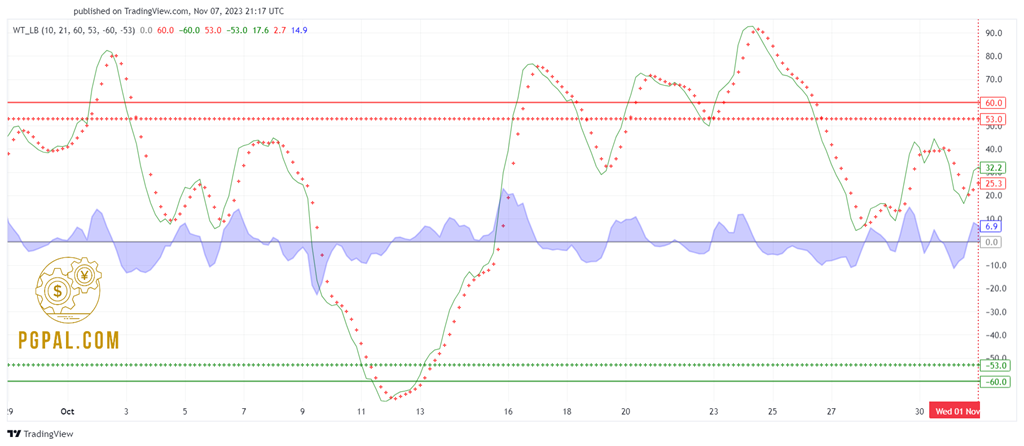
WaveTrend Oscillator is a port of a famous TS/MT indicator.When the oscillator is above the overbought band (red lines) and crosses down the signal (dotted line), it is usually a good SELL signal. Similarly, when the oscillator crosses above the signal when below the Oversold band (green lines), it is a good BUY signal.
I have marked some cross-overs in the above chart. As you can see, they are *not* the only useful signals WT generates. Try it on your instrument and let me know what you think.
Required Python libraries:
import pandas as pd
import pandas_ta as taa
import matplotlib.pyplot as plt
PgPal description:
After coding this indicator in Python, its results were compared with the TradingView site to verify the complete model.
Python programming language results – WaveTrend Oscillator WT (LazyBear)
The results of the TradingView site – WaveTrend Oscillator WT (LazyBear)
related products

UCS Murrey’s Math Oscillator V2 (UDAY_C_Santhakumar) python
| help file | Available |
| short name | UCS_MMLO |
| language | python code |
Squeeze Momentum Indicator (LazyBear) Python
| help file | Available |
| short name | SQZMOM_LB |
| language | python code |
CM Williams Vix Fix Finds Market Bottoms (ChrisMoody) python
| help file | Available |
| short name | CM_Williams_Vix_Fix |
| language | python code |
Blackflag FTS SwingArm ATR Trend Indicator (Jose Azcarate) python
| help file | Available |
| short name | Blackflag FTS |
| language | python code |
reviews
there are no reviews yet.